Earlier in 2015, we developed a new kind of chart to provide a more real-time indication of the relative health of the private sector of the U.S. economy, in which we tracked the cumulative number of dividend cuts being announced each day through each calendar quarter, which we've periodically updated throughout the year.
That exercise helps us get a sense of the extent to which economic distress may be building in the U.S. economy should the number of companies taking the painful action of cutting cash dividend payments to their shareholders rise above a given threshold.
Based on our observations of the available data going back to January 2004, if 10 or fewer firms announce dividend cuts in a given month-long period, the U.S. economy as a whole can be considered to be relatively healthy. But once the number of dividend cutting firms rises above that threshold, it indicates that recessionary conditions are present in the U.S. economy.
If that level rises above 20-25 firms in a month-long period of time however, that elevated number of companies cutting their cash dividend payments to shareholders suggests that some degree of contraction is occurring in the U.S. economy, where the impact will be felt by reduced economic activity, as the affected firms either delay or scale back their previous plans for growing their businesses.
Having covered the basics, let's look at where things stand as of the Friday, 11 December 2015. Our first chart compares the dividend cut trajectory of each quarter in 2015:
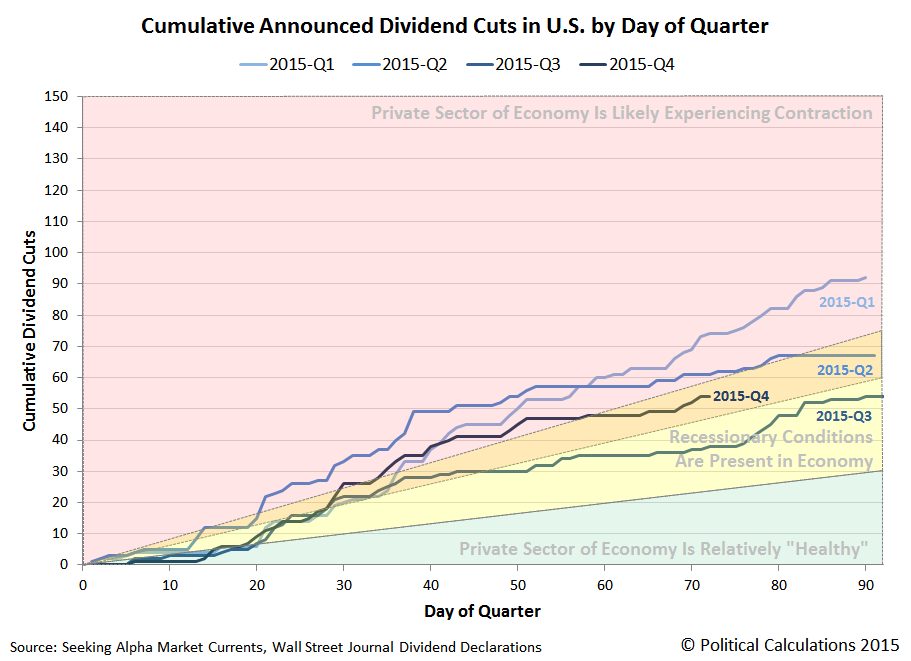
We observe that the dividend cutting trajectory for 2015-Q4 is currently falling within the orange-shaded region of the chart through Day 72 of the quarter, where after having spent much of the earlier part of the quarter in the red, contractionary zone, suggests that the pace of economic growth in the U.S. economy has improved somewhat since mid-November.
Overall, 2015-Q4 is turning out better than 2015-Q1, which saw near-zero economic growth, and also 2015-Q2, which was defined by contraction coming out of 2015-Q1, but improvement as the pace of economic growth improved throughout the rest of the quarter. That improvement continued through most of 2015-Q3.
However, the number of cumulative dividend cuts in 2015-Q4 to date is elevated above those recorded through the same day in 2015-Q3, which confirms that a downturn in economic growth has occurred, which appears to have begun in September 2015.
Our next chart will compare the cumulative dividend cuts in 2015-Q4 with those the fourth quarter of 2014.
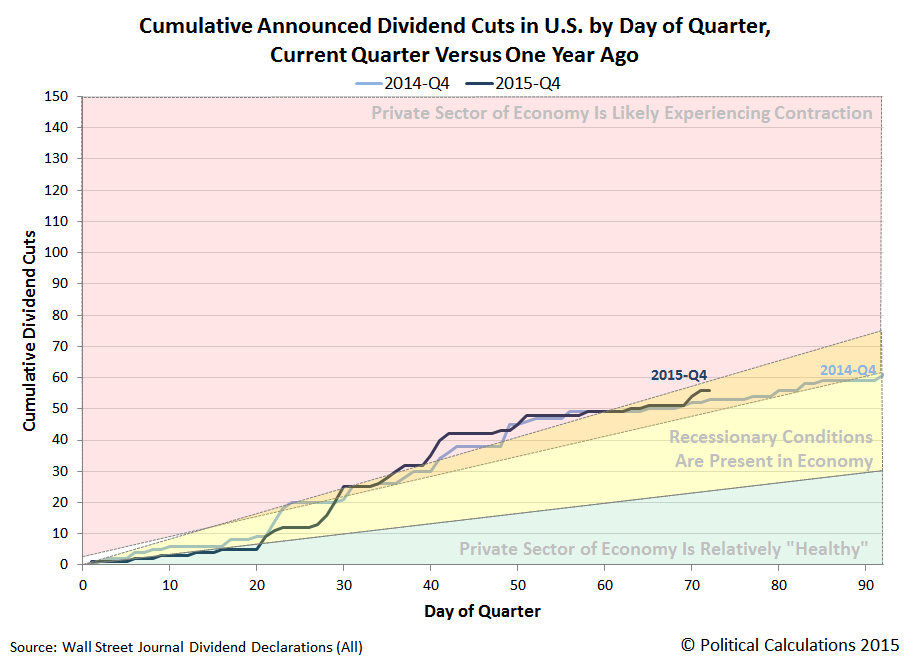
We see that by and large, 2015-Q4 has closely paced 2014-Q4, with history seeming to repeat itself through this point in 2015-Q4. At present, the trajectory of 2015-Q4 is slightly more negative than 2014-Q4, which is a development that has mainly taken place in the last week, which saw oil pipeline giant Kinder Morgan (NYSE: KMI) slash its dividend by 75% and the U.S.' largest copper miner Freeport McMoRan (NYSE: FCX) eliminate its dividend, while the U.S.' Number 2 and 3 oil companies Chevron (NYSE: CVX) and ConocoPhilips (NYSE: COP) kept their dividend payouts at their previously promised levels, but with the caveat that they would slash their previously planned capital expenditures by 25% each going forward, while Chevron will also lay off 10% of its employees, because that's what they believe it will take to avoid having to cut their dividends in the face of their forecasts for dwindling revenues.
We'll give the next-to-final word to Standard and Poor's Howard Silverblatt, whose comments comparing 2015 to 2014 overall through November in each year were reported in USA Today:
Dividend decreases are up 62% in 2015 from last year through the end of November, says Howard Silverblatt, senior index analyst at S&P Dow Jones Indices. Worse yet, outright omissions more than doubled to 100.
The first half of 2016 is shaping up to be a challenging period for investors, as dividend cuts through this point in 2015-Q4 are indicating that the U.S. economy is somewhere between slowing-to-slow growth and contraction.
Data Sources
Seeking Alpha Market Currents. Filtered for Dividends. [Online Database]. Accessed 13 December 2015.
Wall Street Journal. Dividend Declarations. [Online Database]. Accessed 13 December 2015.
Labels: dividends
Welcome to the blogosphere's toolchest! Here, unlike other blogs dedicated to analyzing current events, we create easy-to-use, simple tools to do the math related to them so you can get in on the action too! If you would like to learn more about these tools, or if you would like to contribute ideas to develop for this blog, please e-mail us at:
ironman at politicalcalculations
Thanks in advance!
Closing values for previous trading day.
This site is primarily powered by:
CSS Validation

RSS Site Feed
JavaScript
The tools on this site are built using JavaScript. If you would like to learn more, one of the best free resources on the web is available at W3Schools.com.
Other Cool Resources
Blog Roll


