
We've been following the health of China's economy, as viewed through the goods and services it imports from the United States, for a very long time. As a result of our ongoing analysis, we were among the very first to confirm that China's economy was encountering severe headwinds in its centrally planned attempt to transition from a manufactured good-export oriented economy to a services-based one.
Yesterday, we showed that exchange rate-adjusted year-over-year growth rate of the value of the goods that China imports from the U.S. had fallen to the lowest level they've been since July 2009, falling well below the level where this measure of economic growth last bottomed in February 2015.
At the time, China's political leaders were so concerned that they significantly ramped up their efforts to stimulate the nation's economy.
And they succeeded, which we confirmed as the growth rate of China's imports from the U.S. rebounded in the spring and through summer of 2015, albeit with some month-to-month volatility.
That changed for the worse in October 2015, which is when the year over year growth rate of China's imports from the U.S. plunged from +4.8% in the previous month to -7.0%, a negative swing of 11.8%. In the two months since for which we have data from the U.S. Census Bureau, it has only continued to fall.
Here's where things get interesting. In 2015, we began developing a new economic indicator that can provide insight into the near-real time health of the global economy. Using the measurements of the concentration of carbon dioxide in the Earth's atmosphere taken in the remote Pacific Ocean at the Mauna Loa Observatory, we were able to correlate changes in the rate at which atmospheric CO2 is changing with recessions or other major business cycle downturns in the global economy.
The latest version of the chart we produced to visualize that correlation is presented below, which includes the most recent data reported by the Mauna Loa Observatory on 5 February 2016.
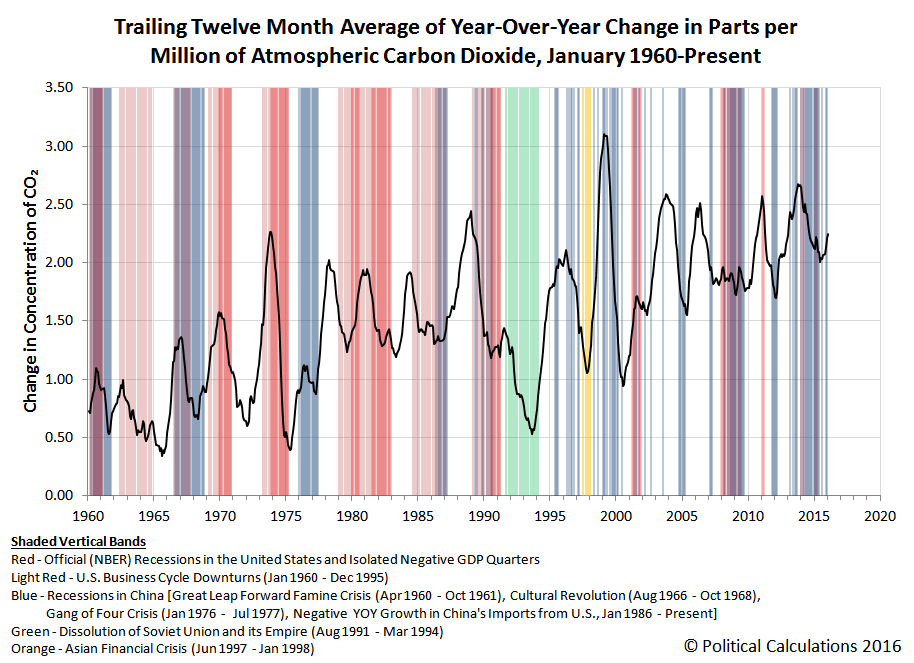
In this chart, we observe that the rate at which carbon dioxide is being added to the Earth's atmosphere bottomed in June 2015 and has increased in each of the months since, which directly contradicts what China's U.S. import trade data is communicating.
While we expect there to be a time lag between when there is a change in economic activity and when the resulting change in a national economy's carbon dioxide emissions might be detected in the middle of the Pacific Ocean, the upswing we see in the atmospheric CO2 levels is both larger than we would have anticipated and has extended longer than we would have anticipated as well.
We think that this sustained acceleration may very well be a direct consequence of the emergency stimulus measures that China's leadership undertook began in March 2015.

In this hypothesis, we suspect that China's leadership acted to accelerate the early completion of a number of construction projects that were already in progress - and particularly, new coal-fired power plants, which typically take 3 to 4 years to build and put into service.
By getting these plants into service more quickly, China's leaders may have hoped that the additional electricity that they would generate would be capable of sustaining additional economic activity, which would justify the acceleration of these projects.
Unfortunately, the trade data suggests that plan is not working out as well as China's leaders may have hoped. China, the world's largest producer of carbon dioxide emissions by a very wide margin, is burning more coal and is exporting an increased amount of CO2 into the Earth's atmosphere as it brings these new plants online sooner than previously planned. But the demand for what might be done with the additional electricity generated by these newly chartered power plants is not sufficiently developed enough to take advantage of the increased capacity to sustain new economic activity, which we can confirm by China's plunging level of imports.
That's the kind of dynamic that can produce the national economy equivalent of a dead cat bounce, where the efforts of national leaders to stimulate an economy to reverse its contraction lead to short term gains that ultimately prove to be unsustainable because of the imbalances they create.
In the worst case, they would make their nation's economic situation worse because they've added capacity that would take decades to fill, which in the mean time, virtually ensures the negative economic outcome they had sought to avoid. In this scenario, the increased supply without increased demand causes prices to plunge, starving firms of the revenue they need to cover their costs of staying in business (particularly the cost of any debt they may have taken on), which leads to defaults and business failures, which become greatly amplified if they prompt failures in banks and other institutions.
If that happens, we'll definitely see it in both the trade data and in the air.
Image Credit: National Science Foundation
Labels: economics, environment, recession, trade
Welcome to the blogosphere's toolchest! Here, unlike other blogs dedicated to analyzing current events, we create easy-to-use, simple tools to do the math related to them so you can get in on the action too! If you would like to learn more about these tools, or if you would like to contribute ideas to develop for this blog, please e-mail us at:
ironman at politicalcalculations
Thanks in advance!
Closing values for previous trading day.
This site is primarily powered by:
CSS Validation

RSS Site Feed
JavaScript
The tools on this site are built using JavaScript. If you would like to learn more, one of the best free resources on the web is available at W3Schools.com.
Other Cool Resources
Blog Roll


